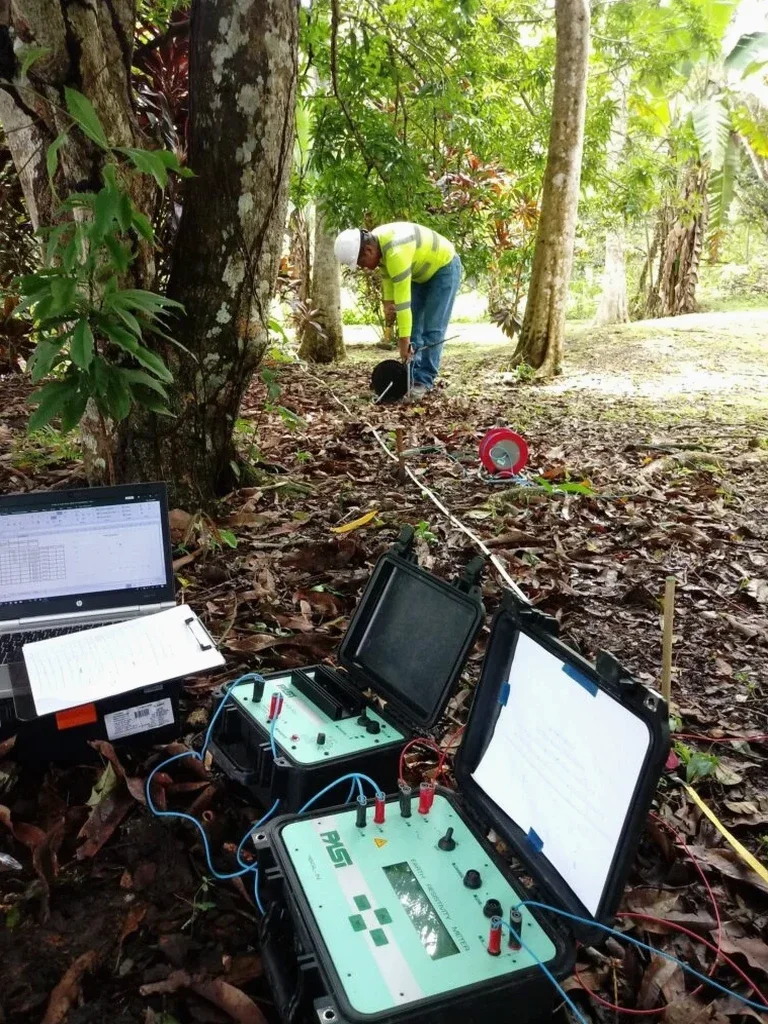
Napier’s rebuild after the 1931 earthquake reshaped the city onto the gravels of the Heretaunga Plains, but the subsurface here is far from uniform. Beneath the Art Deco streets, lenses of silt, sand, and pumice-rich alluvium alternate unpredictably, often within the span of a single section. Our laboratory team runs vertical electrical sounding surveys to map these contrasts before a single footing is poured. The method works by injecting current into the ground and measuring resistivity variations that distinguish compact gravels from water-saturated silts or buried paleochannels. For deeper targets, we pair resistivity profiling with seismic refraction to cross-check bedrock depth. On coastal sites near Ahuriri, where saline intrusion affects readings, we also run CPT testing to calibrate the geophysical response against direct tip resistance and pore pressure data. The result is a ground model that makes sense of Napier’s complex post-depositional history.
Resistivity gives us the electrical signature of the ground; when calibrated against borehole data, it reveals layers that mechanical drilling alone might miss.
Local context
The most common mistake we see on the Heretaunga Plains is assuming that uniform surface topography means uniform subsurface conditions. A contractor will excavate for a warehouse pad, hit a buried gravel channel at three metres, and suddenly face differential settlement issues that weren't in the initial budget. Resistivity sounding catches those paleochannels early: the gravel shows high resistivity, the surrounding silt shows low, and the boundary between them is sharp on a pseudo-section. Missing that boundary means a slab designed for homogeneous ground ends up spanning two materials with completely different stiffness. Remediation costs in Napier's commercial zones run high, especially when delays affect lease commencement dates. A half-day VES survey costs a fraction of that risk and gives the design team a continuous profile rather than isolated point data from boreholes alone.
Questions and answers
What does an electrical resistivity survey in Napier typically cost?
For a standard VES sounding or a short 2D tomography line on a residential or light commercial site in Napier, budgets usually fall between NZ$1,160 and NZ$1,760 before GST. The final figure depends on array length, number of soundings, terrain access, and whether we need to integrate results with CPT or borehole calibration data.
How deep can resistivity surveys investigate on the Heretaunga Plains?
Investigation depth depends on the electrode spread length, not on a physical probe. With a maximum Schlumberger array extension, we can reach depths of 50 to 80 metres in Napier's alluvial soils, which is sufficient to map the contact between Quaternary gravels and the underlying basement. For deeper targets, we adjust the array geometry accordingly.
Can resistivity distinguish between groundwater and clay layers?
Both saturated clays and groundwater in porous gravels lower resistivity, so the raw measurement alone can be ambiguous. We resolve this by calibrating the resistivity profile against at least one borehole log or CPT sounding on the same site, which tells us whether the conductive zone is a clay-rich aquitard or a water-bearing gravel aquifer.
How long does a VES survey take on a typical Napier residential section?
For a single vertical electrical sounding with a maximum spread of 100 metres, field acquisition takes about 45 to 90 minutes, plus setup time. A 2D tomography line of 200 metres may take half a day. We deliver interpreted profiles within three to five working days, including correlation with any existing borehole data for the area.